Creating a Serveless Dashboard
R
Quarto
Dashboard
Sharing results is easy!
A while ago I wrote about creating a serverless dashboard (with no server dependencies) using Flexdashboard. As some of the functions now are no longer supported, I found a good alternative called “Quarto Dashboards”. Quarto Dashboards allow to create dashboards using Python, R, Julia, and Observable. More details are here.
Dashboards can be created either using Jupyter notebooks (.ipynb) or using plain text markdown (.qmd). I am showing how to create one using RStudio.
- Click File -> New File -> Quarto Document
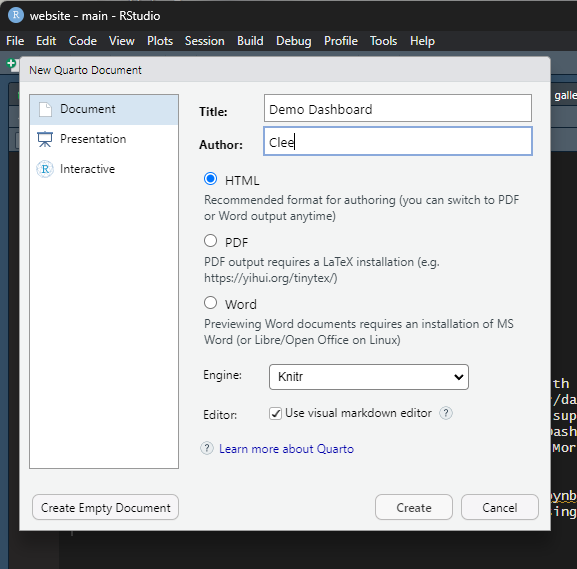
- A new
.qmdfile is created
Here is the code for the visual version of the dashboard link
Here is the plain text .qmd version of the dashboard.
- The document options define the title and author for the navigation bar as well as specifying the use of the dashboard format.
- By default, dashboard pages are laid out first by row, then by column. In this demo, I changed this by specifying the
orientation: columnsdocument option:
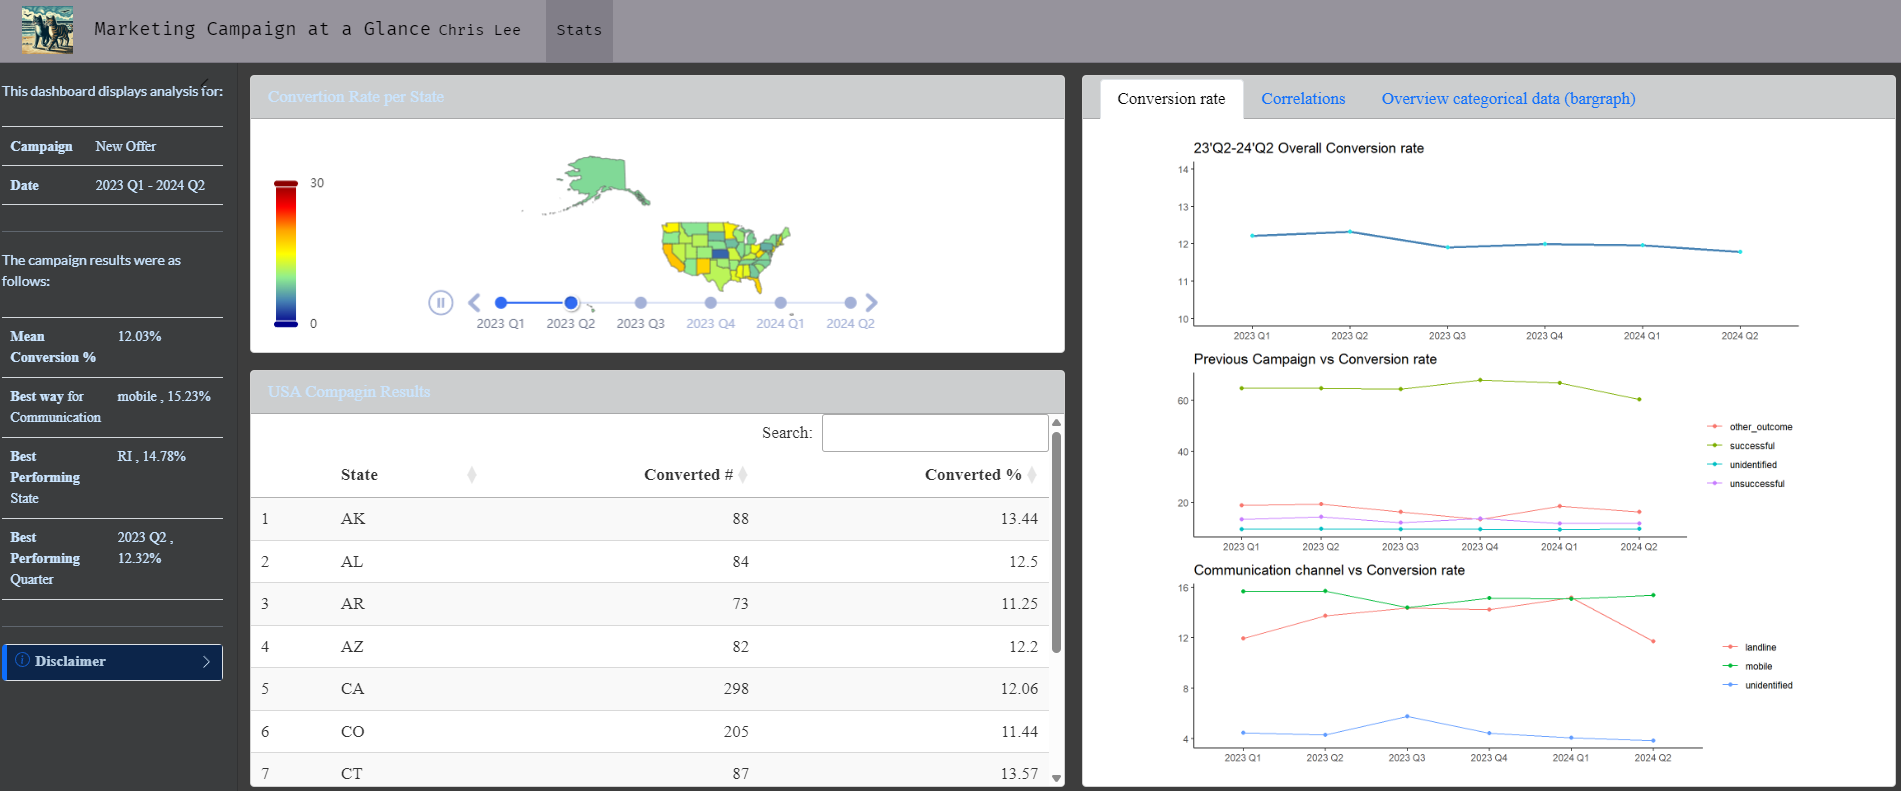
title: "Marketing Campaign at a Glance"
author:
    name: Chris Lee
    url: https://clfee.github.io/
date: 2024-07-15
format:
  dashboard:
    orientation: columns
    nav-buttons: [github]
    github: https://github.com/clfee
logo: "/assets/images/cmm1.PNG"
theme: custom.scss
editor_options:
chunk_output_type: console- Each row in the dashboard that is not given an explicit height will determine its size by either filling available space or by flowing to its natural height.Here I changed the figure height by specifying the
#| fig-height: 6
#| title: Correlations
#| fig-height: 6
#| padding: 0;
dt <- train
More details about full code.
Back to top