In the fast-paced world of data analysis, efficiency is key. Automated reporting is revolutionizing how we handle recurring data-rich reports, offering on-demand production and enhanced data exploration capabilities. This innovative approach not only saves time but also allows for deeper, more strategic insights. Parameterized reporting is a cutting-edge technique that enables simultaneous generation of multiple reports. This method not only boosts productivity but also significantly reduces errors associated with manual data handling.
Goal : The objective of this report is to demonstrate how to create automated custom reports with Quarto and Purrr in R to track patient days from public data.
Real-World Application: California MRSA Data Analysis
To illustrate the power of automated reporting, let’s consider a case study using data from the California California Health and Human Services Open Data Portal. The demo uses the data from All California general acute care hospitals are required to report Methicillin-resistant Staphylococcus aureus (MRSA) bloodstream infection (BSI) cases that occur following hospitalization. MRSA is a serious, contagious bacterial infection that starts on your skin. It’s a type of staph infection that resists most common antibiotics, making it especially dangerous. Without treatment, MRSA can be deadly.
Step-by-Step Guide
Step 1: Create a Single Report Template
We began by preparing a single report template using data from 2022. This template serves as the foundation for all subsequent reports. Let’s prepare a single report as a template from the data in 2022.
Healthcare Associated Infection Report, 2022
Results
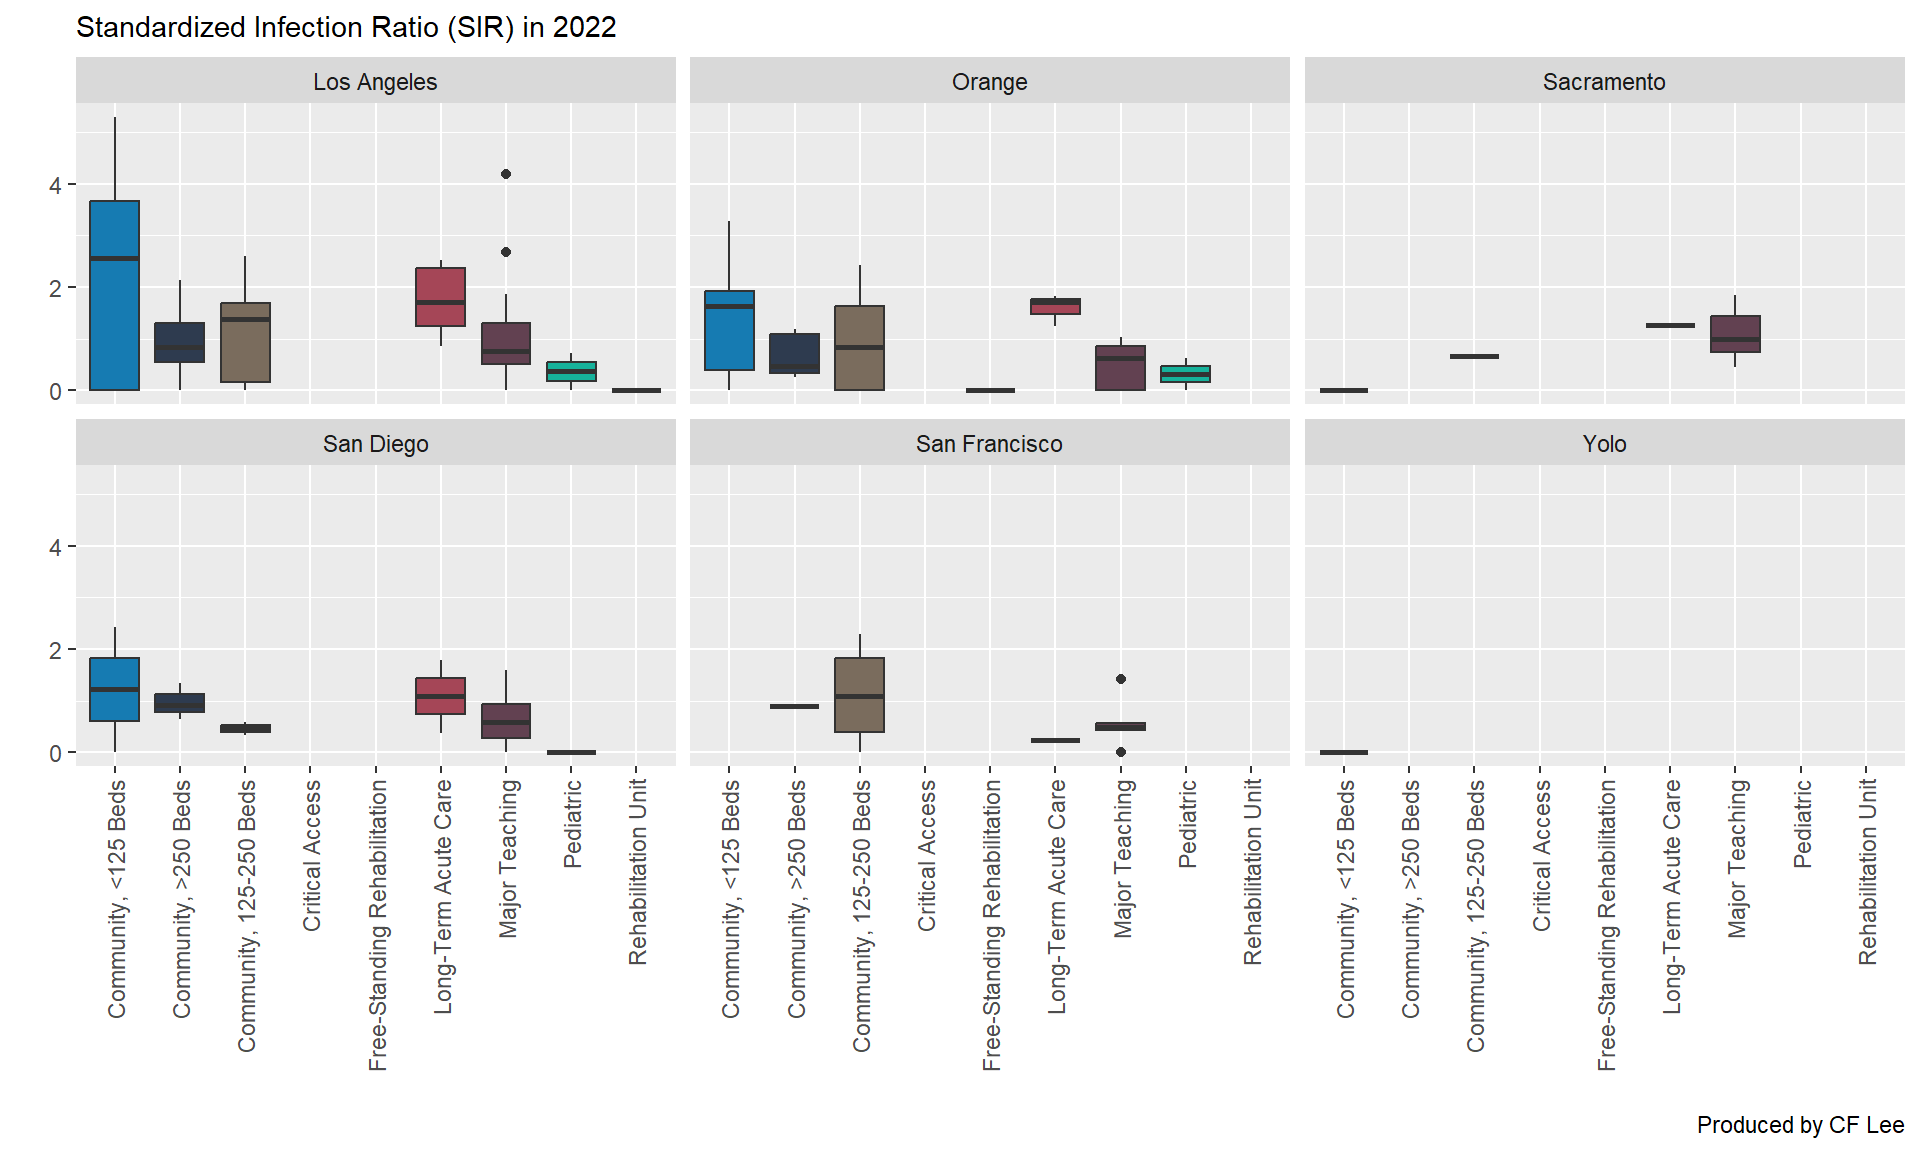
Figure 1: Box plots of Standardized Infection Ratio (SIR) in 2022.
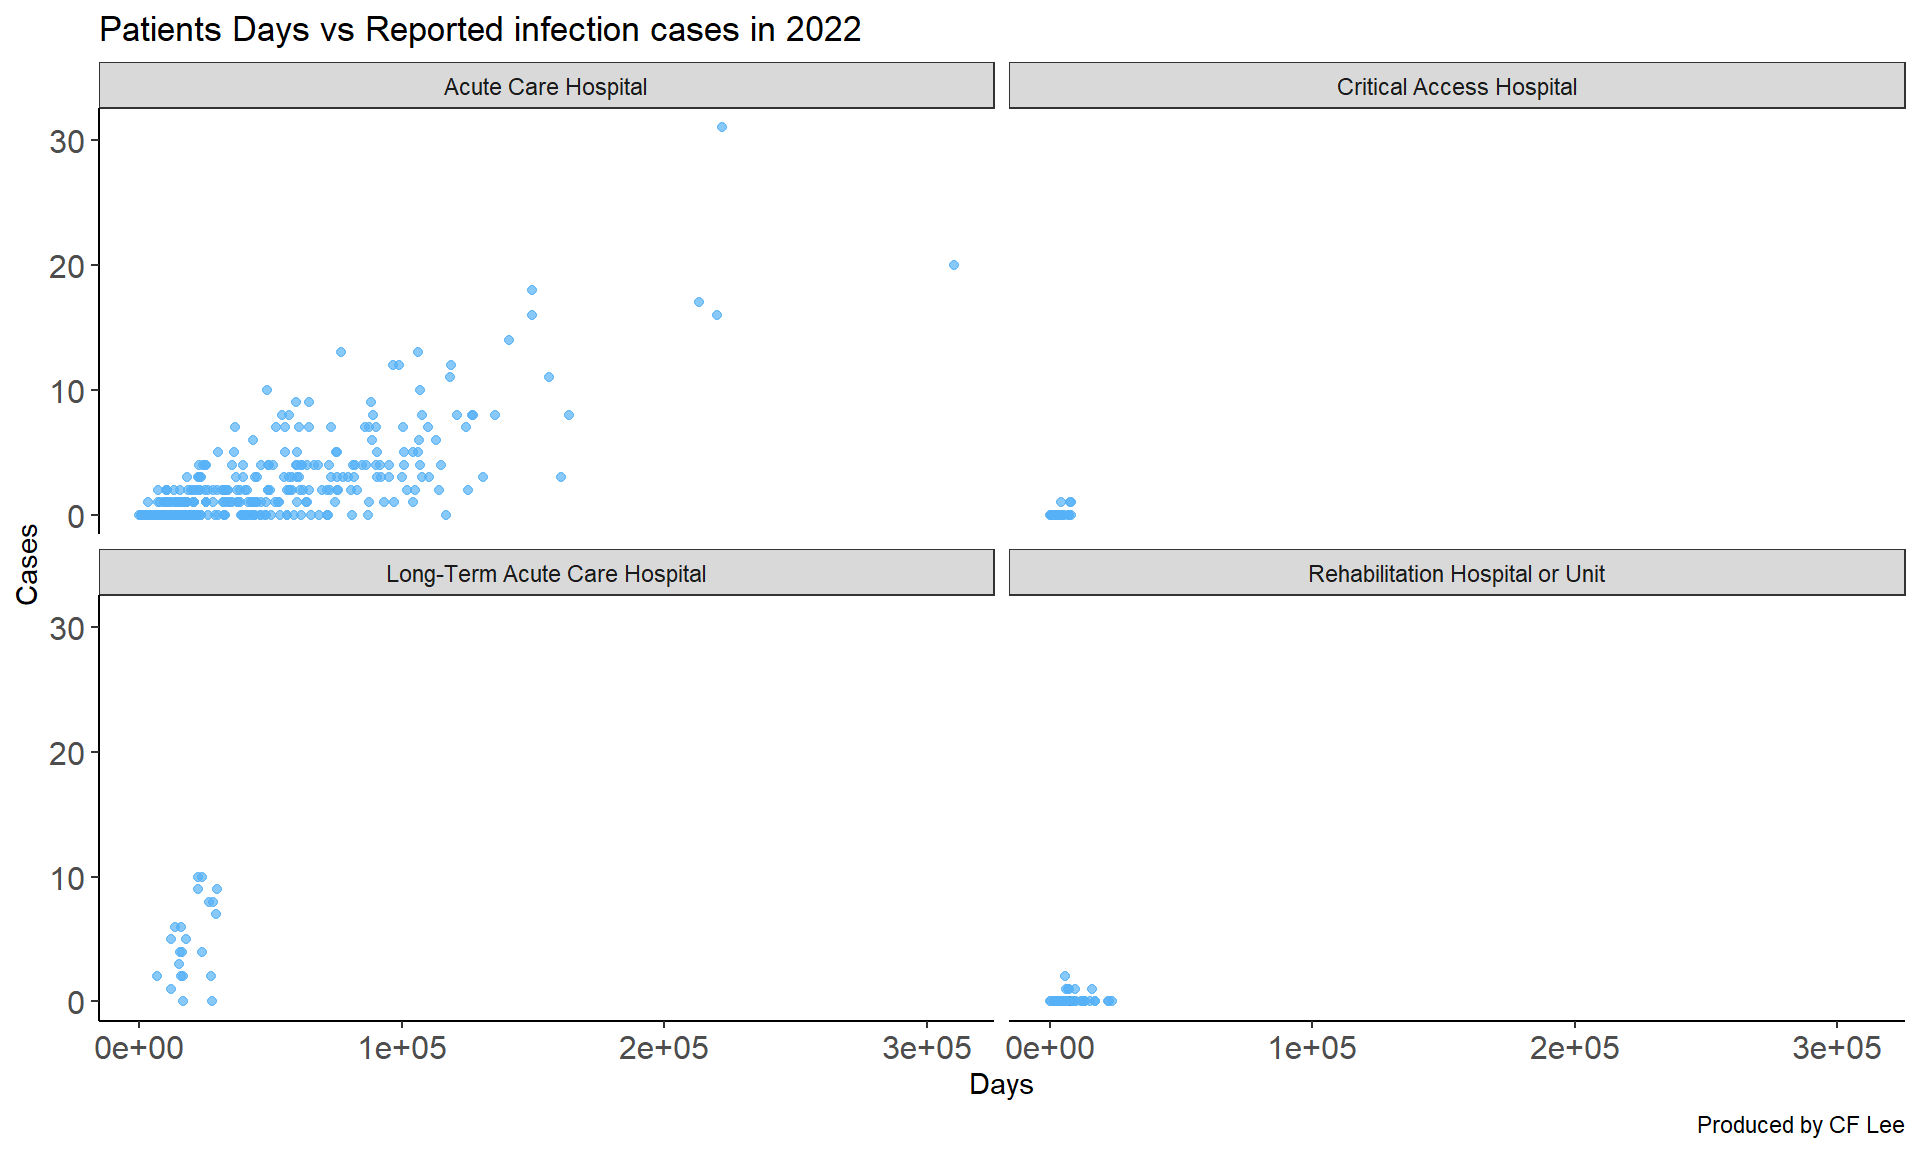
Note: Patient Days is define as below. A count of the number of patients in the hospital during a time period, excluding IRFs and IPFs with their own CCN numbers. A rehabilitation unit (IRF) with its own CCN number reports separately from the rest of the hospital. To calculate patient days, the number of patients is recorded at the same time each day for each day of the month. At the end of the month, the daily counts are summed. See the NHSN website: http://www.cdc.gov/nhsn.
Step 2: Generate All Report Variations
After creating the single report, we used an R script to render the parameterized Quarto template with each defined parameter. This step allows for the simultaneous generation of all report variations, ensuring consistency and accuracy.To do this, write an R script to render the parameterized Quarto template with each of the defined parameters.
In our example the code looks like this,
# 1. First create a dataframe

data <- expand.grid(
  year = c(2019,2021:2023),
  record_date = Sys.Date(),
  stringsAsFactors = FALSE)

df <- data |>
  dplyr::mutate(
    output_format = "html",       # Output format (html, word, etc.)
    output_file = paste(          # Output file name
      year, "report.html",
      sep = "-"
    ),
    execute_params = purrr::map2( # Named list of parameters
      record_date, year,
      \(record_date, year) list(record_date = record_date, year = year)
    )
  ) |>
  dplyr::select(-c(record_date, year))

df

# 2. Use purrr::pwalk() to map over each row of the dataframe and render each report variation.

purrr::pwalk(
  .l = df,                      # Dataframe to map over
  .f = quarto::quarto_render,   # Quarto render function
  input = "demo_autoreport.qmd",       # Named arguments of .f
  .progress = TRUE              # Optionally, show a progress bar
)
By adopting this automated approach, analysts can shift their focus from report creation to data interpretation, leading to more impact decision-making and strategic planning.
Automatically generated reports, one after another!
Resources
The raw data is obtained from California Health and Human Services Open Data Portal datasets